Okay. So I am going to get a little technical here, but I’ll still keep it simple. The definition of Gross Domestic Product (GDP) is:(Wikipedia)
“The gross domestic product (GDP) or gross domestic income (GDI) is a measure of a country’s overall economic output. It is the market value of all final goods and services made within the borders of a country in a year.”
Now remember the our college/grad student in the last post? His student loans were not factored into his debt obligation because they were deferred. Much the same way our government’s future obligations for entitlement programs are not factored into our current budget expenses because those expenses are in essence deferred. But remember there are certain rules about debt. Personal debt should not be more than 36% of gross income.
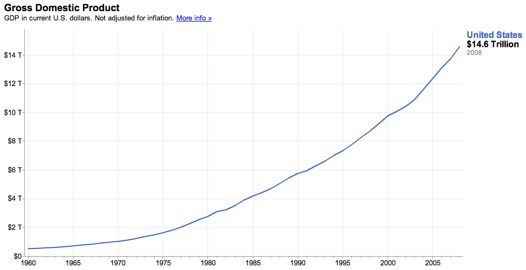
What is the government’s gross income? Its GDP. Below is a graph of our GDP:
You can see that our GDP has risen pretty steadily, but unfortunately so has our debt. Ever experience the phenomenon of getting a raise or a bonus at work only to spend every last dime of it and wonder where it went?
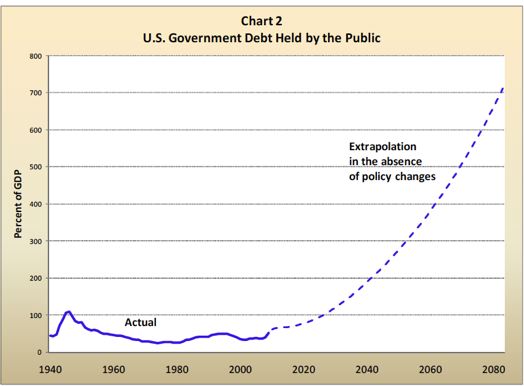
I’ll bet the answer is yes. And alas Uncle Sam is no different. Here is our public debt as a percentage of GDP.
Is our debt picture too high? Well, we can see from the diagram that our debt as a percentage of GDP was highest after World War II. How high is it today as a percentage of GDP? Alas, I’ll let the Citizen’s Guide to the Unified Budget tell you:
“Historically, the Government has incurred debt when it borrows from the public to finance
budget deficits. The economic recovery efforts of the past year precipitated a need to
dramatically increase the amount of funds borrowed from the public. However, part of this
increase has financed investments that the Government expects to ultimately recover in whole or
in part. The Government’s debt held by the public totaled approximately $7.6 trillion at the end
of FY 2009, and was held by the public in the form of Treasury securities, such as bills, notes,
and bonds, and accrued interest payable. The “public” consists of individuals, corporations, state
and local governments, Federal Reserve Banks, and foreign governments. In addition to debt held by the public, the Government has outstanding nearly $4.4 trillion of intragovernmental debt, which arises when one part of the Government borrows from another. It represents debt held by Government funds, including the Social Security ($2.5 trillion) and Medicare ($372 billion) trust funds. (emphasis added)”
That would be $7.6 Trillion dollars plus $4.4 trillion dollars or $12 Trillion dollars against a GDP of $14.6 trillion dollars or 82%. OUCH! Actually this number is a bit worse because that GDP figure was from 2008. Our GDP has declined due to the recession. What happens to the people that we know who are in debt up to their eyeballs unless they make some dramatic changes? A word of caution. I am looking at total debt as a percent of GDP, most figures that you see will look at public debt only as a percent of GDP. Public debt is debt held by the public: private citizens, other governments, corporations etc. Public debt as a percentage of GDP is 50%. I look at total debt because 1. I don’t play games with balance sheets and 2. I consider intra-governmental debt because it is created by borrowing from Medicare and Social Security as important as any debt we owe to anyone else.
Now how did this budgetary mess happen? Had we not had the recent housing bubble and Great Recession, we would still be in this mess, it is just that the recession has increased revenue shortfalls (think declining tax revenue) and made the conversation more urgent.
Again from the Citizen’s Guide to the Unified Budget:
“Strong economic growth and fundamental fiscal decisions taken in the early 1990s, including measures to reduce the Federal deficit and implementation of strong “Pay as You Go” (“Paygo”) rules, generated a significant reduction in the debt-to-GDP ratio over the course of the 1990s. From a peak of 49 percent of GDP in 1993, the debt-to-GDP ratio fell to 32 percent in 2001. During the last decade, much of this progress was undone as Paygo rules were allowed to lapse, significant permanent tax cuts were implemented, and entitlements were expanded. By September 2008, the debt-to-GDP ratio was 40% of GDP. The extraordinary demands of the current economic and fiscal crisis have pushed up debt held by the public significantly.”
That last paragraph should put an end to partisan sniping, but it won’t. Who was in the White House during 8 of the last 9 years? George W. Bush. The next to the last sentence describes pretty accurately what was done economically during his Presidency. FDR, a Democrat, was in the White House when the deficit exceeded the entire GDP. He had new technologies, a burgeoning work force and a new and rising tax base on his side. The deficits grew during the Reagan and Bush I administrations, came down during the Clinton Era and went up again under Bush II. The deficits would have gone down during the Reagan and Bush I eras had they actually cut spending while they were cutting taxes (in the end Bush I had to raise taxes), but, alas, they did not. In short each party is responsible for our current debt burden. They need to stop finger pointing.
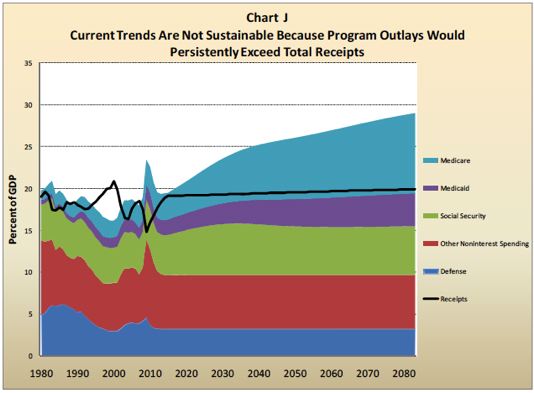
Where are we headed? It ain’t good.
This chart is scary because it doesn’t really take into account the debt I’ve been talking about. This graph looks at income or cashflow. Let me explain. Remember, I said that our total income is about $2 trillion per year. The chart looks at the amount by which expenses will outstrip our income going forward. Again from the Citizen’s Guide:
“Chart J also illustrates the difference between estimated program spending (spending on mandatory and discretionary programs, excluding interest on debt held by the public) and estimated Government receipts.”(emphasis added)
I am going to stop here. Please comment. In my next post, I’ll look at why using the GDP figure makes me nervous.


 Twitter
 Facebook